Project Overview
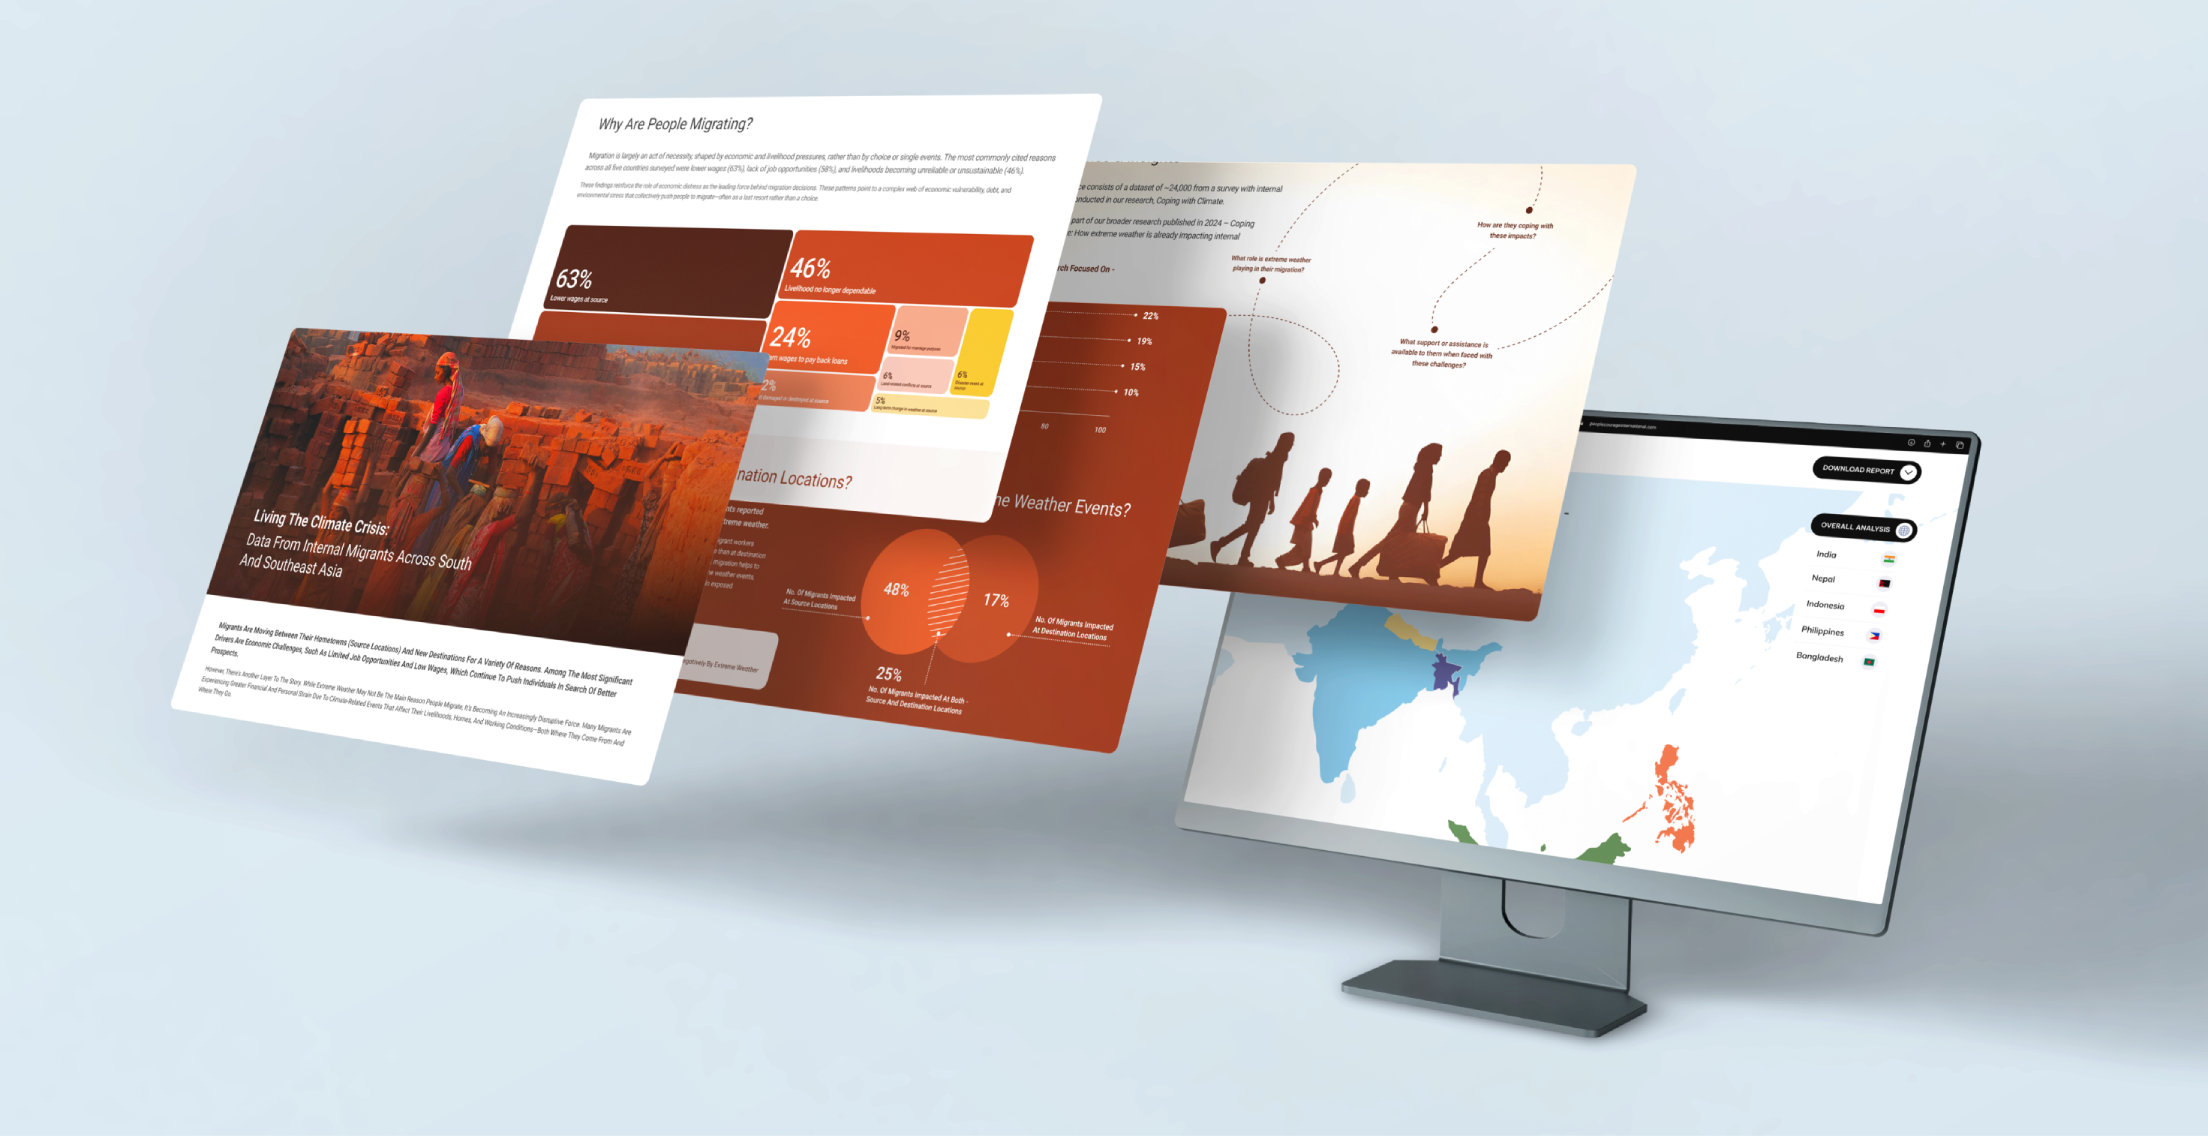
This report uses a massive survey of 23,915 internal migrants from five Asian countries, providing insight into who migrates, why they migrate, and how they migrate.
Target Audience
- Policy Makers & Government Officials
- Researchers, Analysts & Journalists
- International/Non-Governmental Organizations (NGOs)
- The General Public & Civil Society
Project Goal
- To address the challenge of Information Overload and Low Accessibility,
- Clearly present the methodology and source data alongside visualisations to build user confidence in the report's findings.
- Ensure that users (especially policy makers) can easily extract clear implications or recommendations from the data visualizations.
- Enable users to easily compare migration patterns between different South Asian countries or across various time periods (year-over-year).
- Create a layered experience where the general public can access high-level summaries, while researchers can access detailed, filterable data, all within the same platform.
Problem Statement
The core problem is Information Overload and Low Accessibility. Large Excel files and dense survey data are inaccessible to policy makers, journalists, and the general public, preventing data-driven decision-making and public understanding of South Asian migration patterns.
Solution
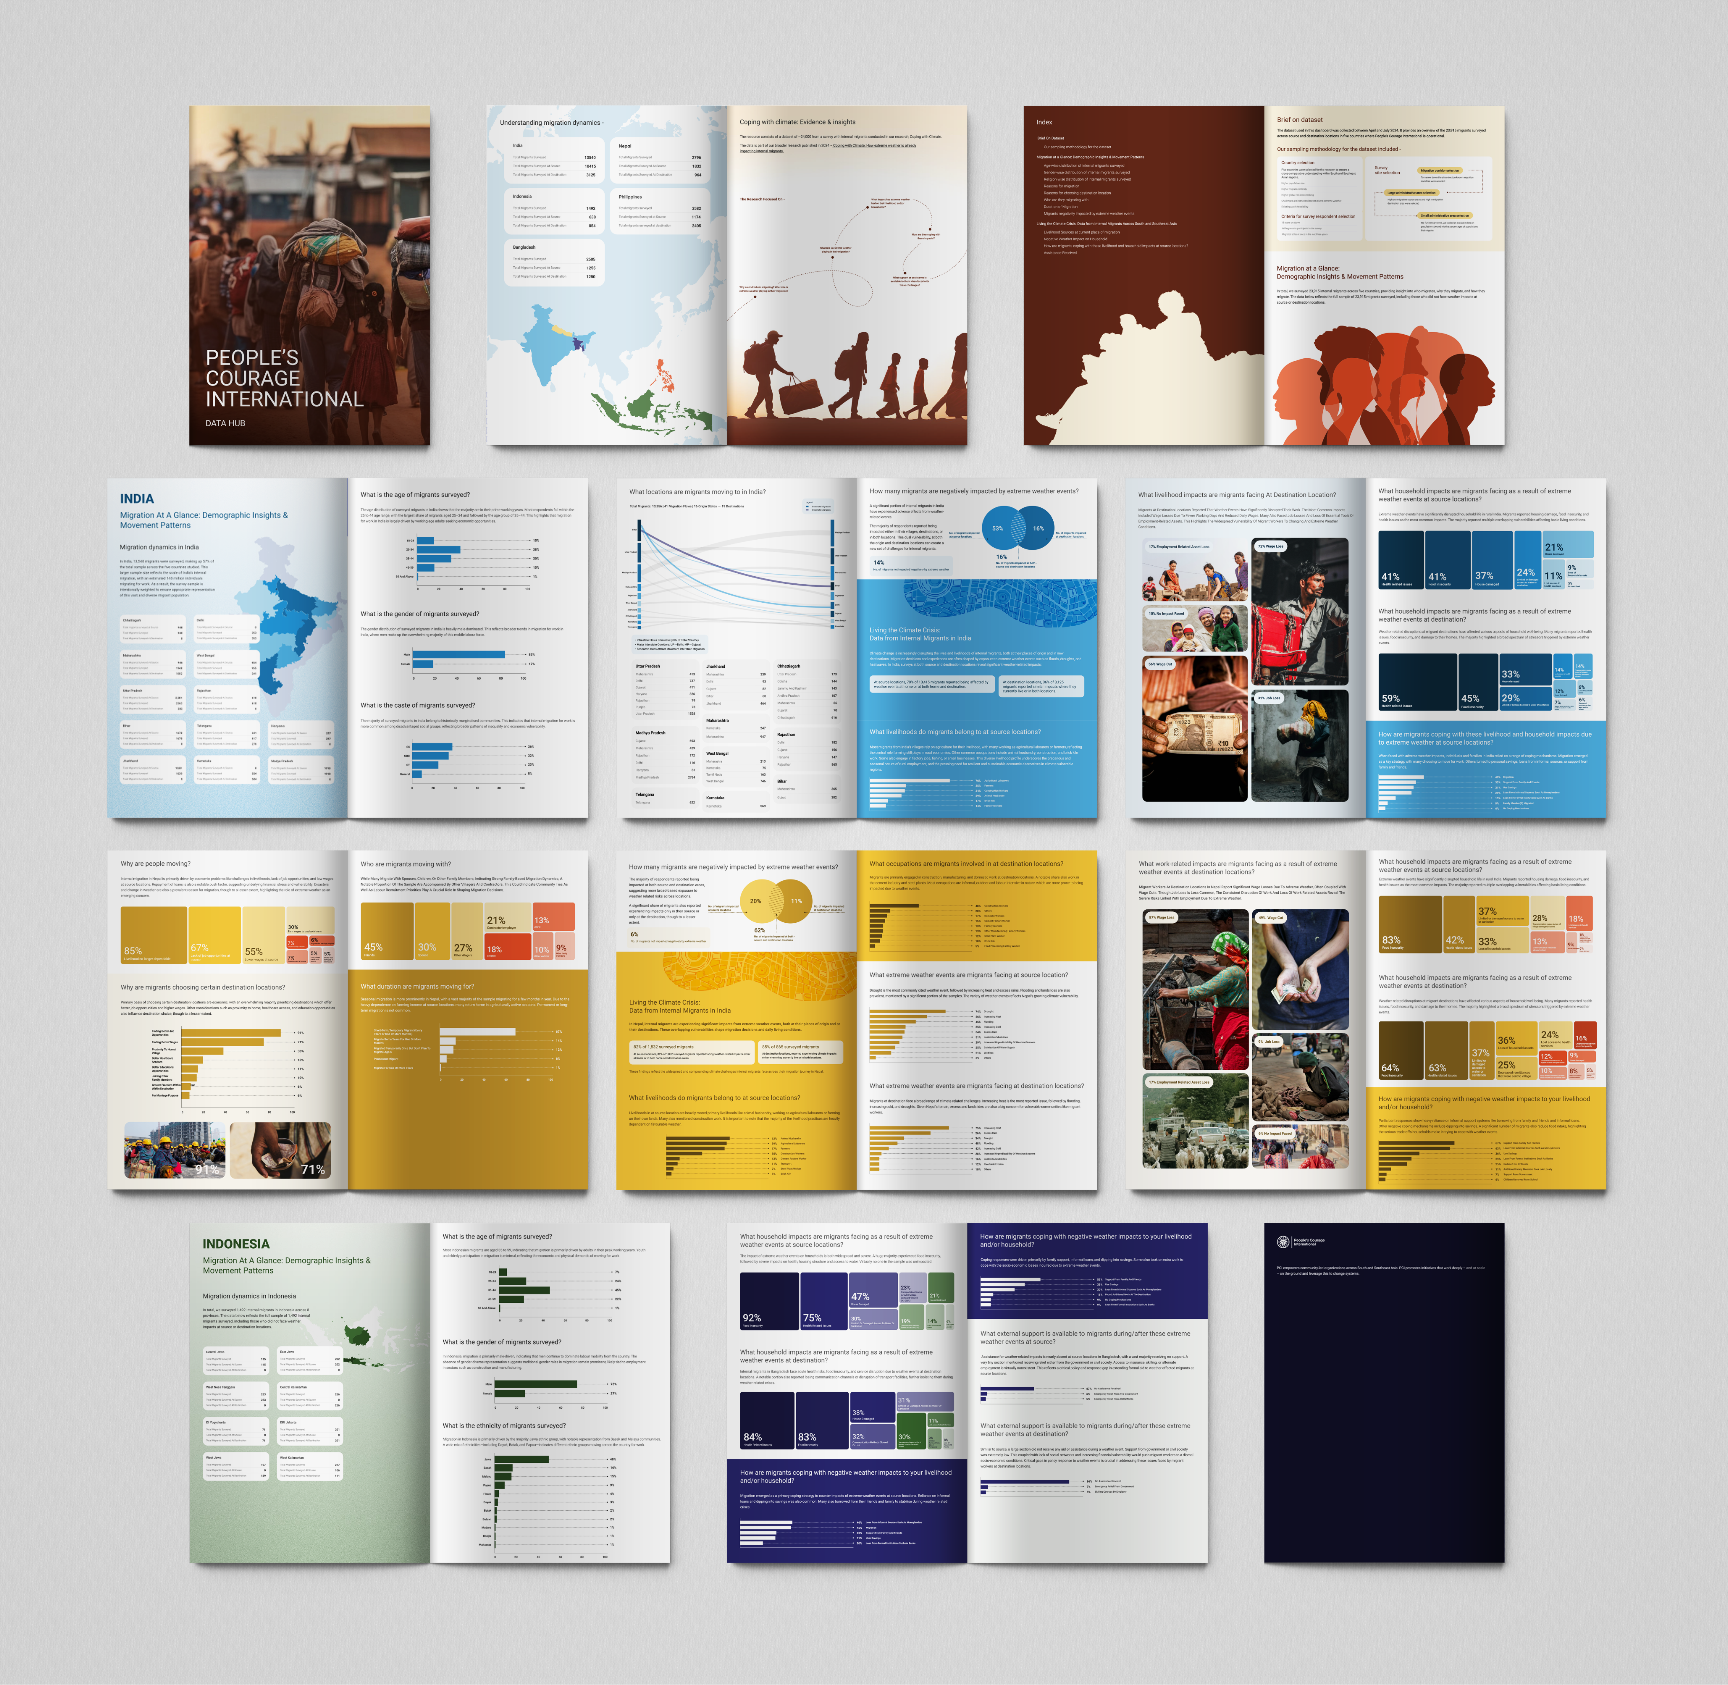
- Structure: We carefully sorted the overwhelming spreadsheet data country & state-wise data across five South Asian countries to make the content digestible. Data was specifically categorised into three sections – Demographics, Impact at Source, Impact at Destination
- Visual Strategy: We moved beyond simple charts, creating custom, interactive maps for each key research question related to demographics and migration patterns. This allowed for immediate visual recognition of spatial trends.
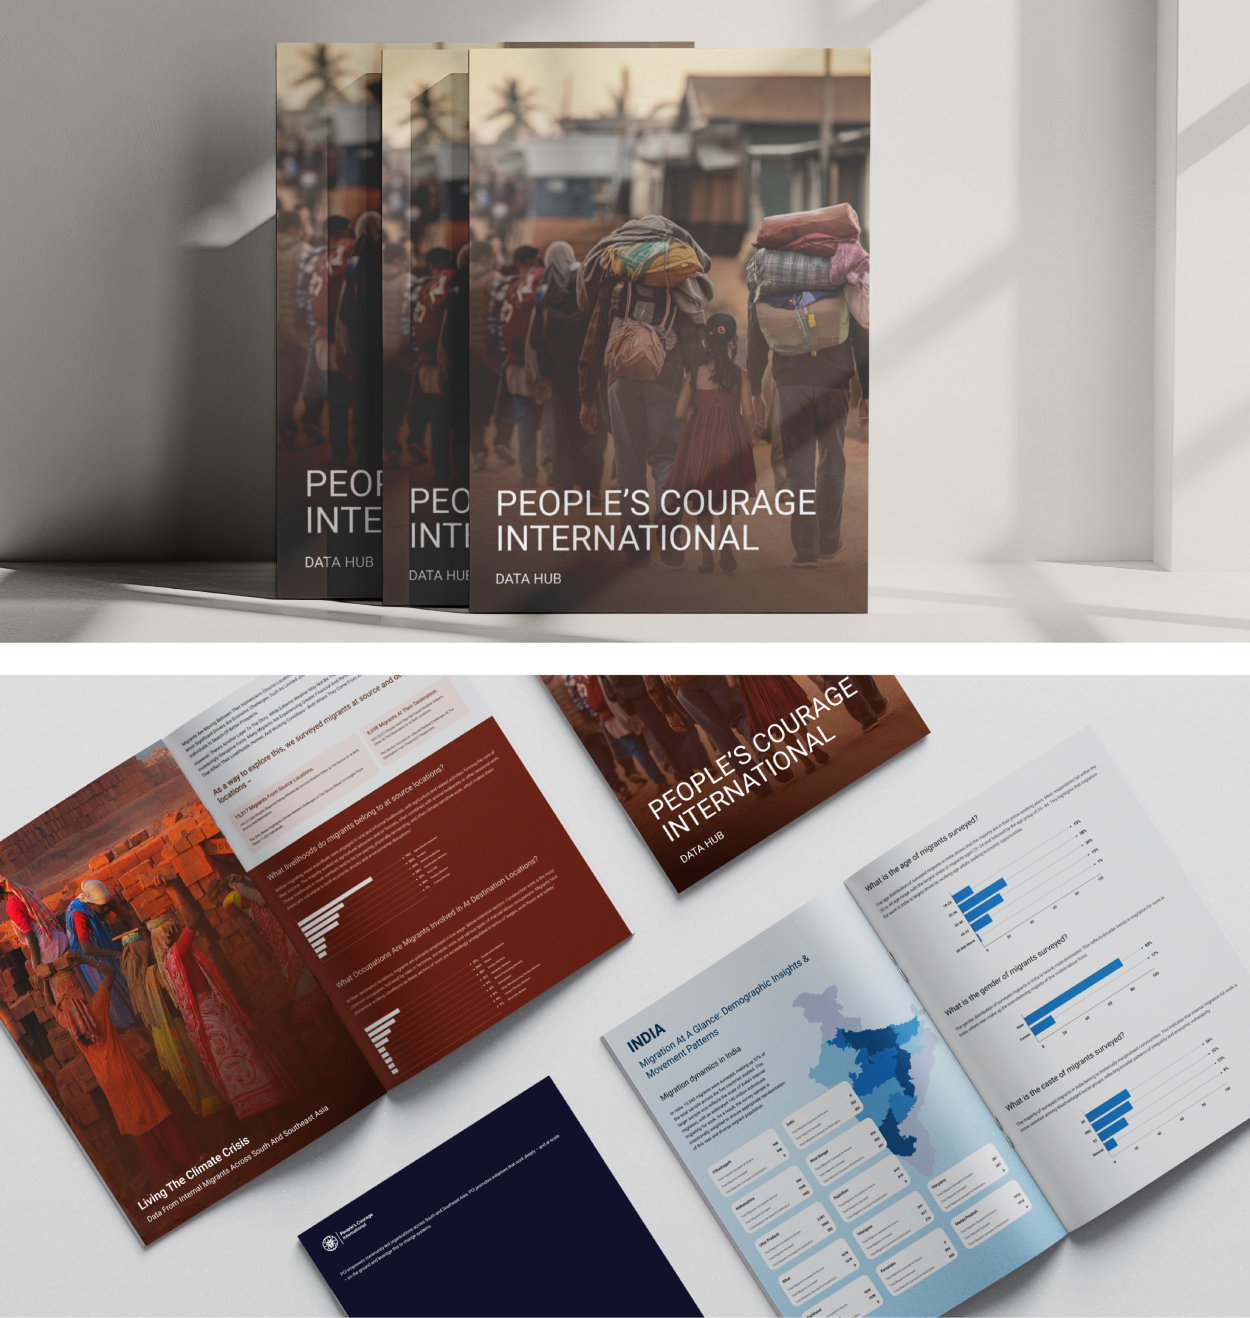
- The final output was a visually appealing format optimised for comprehension, ensuring the complex data was digestible and readable by all target audiences.
- We built both a dynamic website (where anyone can click and filter by country/state) and a simple PDF for easy download. This ensured that journalists, policy makers, and the public could all access the critical report findings effortlessly.
- Colour Palette#624C19
#927125
#C39732
#F4BD3E
#F6CA65
#F8D78B
#FBE5B2
#FDF2D8
#FEF9EC
#12112B
#1B1941
#242256
#2D2A6C
#575589
#817FA7
#ABAAC4
#D5D4E2
#EAEAF1
#424856
#626D81
#8391AC
#B6C4DF
#B6C4DF
#C8D3E7
#DBE1EF
#EDF0F7
#F6F8FB
#103A52
#17567C
#1F73A5
#2790CE
#52A6D8
#7DBCE2
#A9D3EB
#D4E9F5
#EAF4FB
#182914
#243E1D
#305227
#3C6731
#63855A
#8AA483
#B1C2AD
#D8E1D6
#F5F7F4
#5C2211
#8B3319
#B94422
#E7552A
#EC7755
#F1997F
#F5BBAA
#FADDD4
#FDEEEA
#545454
#7E7E7E
#A8A8A8
#D2D2D2
#DBDBDB
#E4E4E4
#EDEDED
#F6F6F6
#FBFBFB
Aa
Roboto
Vorem ipsum dolor sit amet, consectetur adipiscing elit. Nunc vulputate libero et velit interdum, ac aliquet odio mattis. Class aptent taciti sociosqu ad litora torquent per conubia nostra, per inceptos himenaeos. Curabitur tempus urna at turpis condimentum lobortis.