
Project Overview
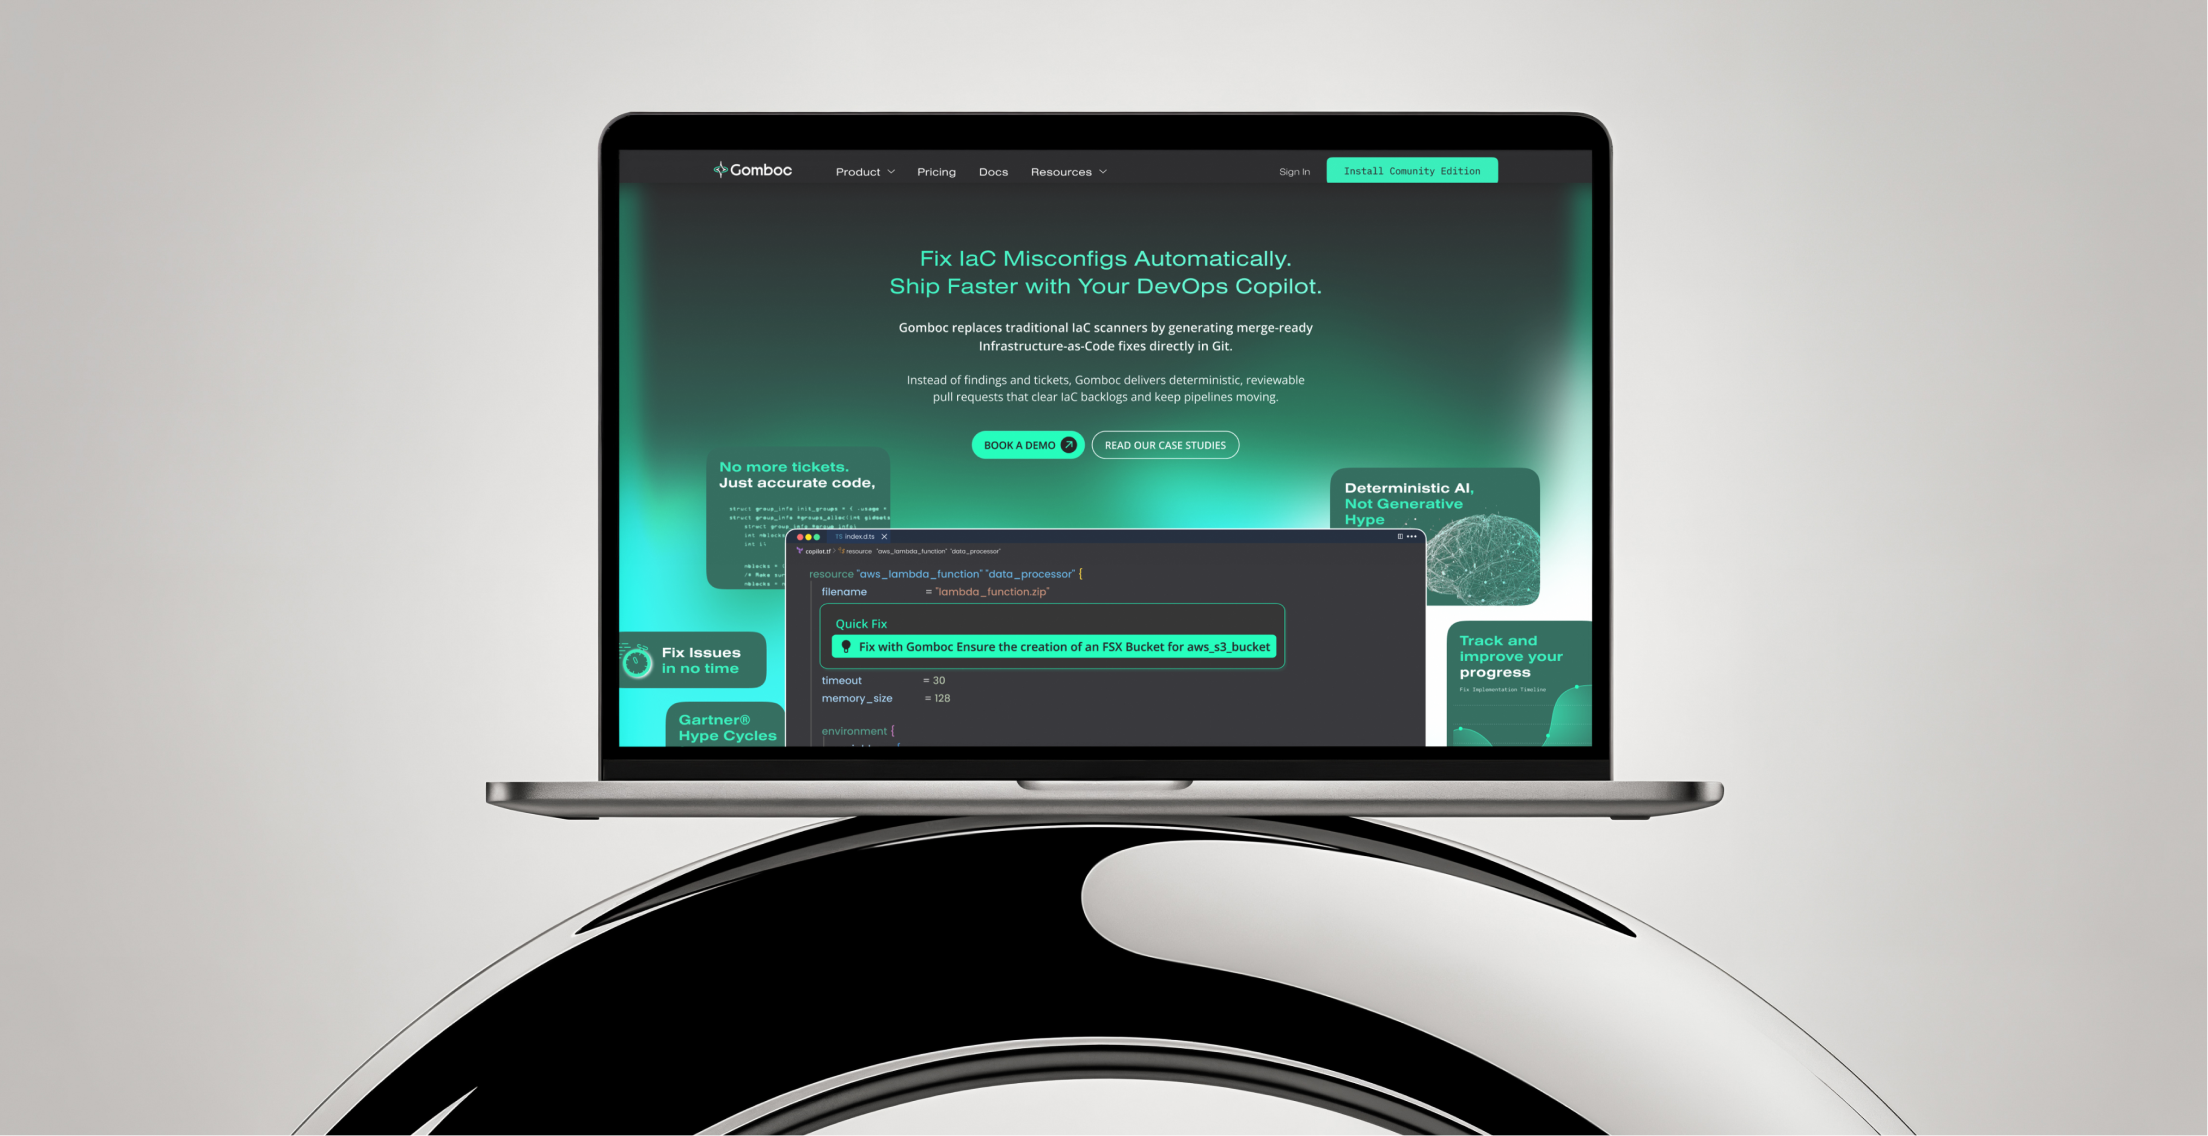
Cybersecurity platform designed to provide enterprise-level threat detection, incident response, and security monitoring
Project Goal
- Improve Site Performance : Reduce page load times
- Optimize Mobile Experience: Create a fully responsive, mobile-first design for 60% mobile traffic
- Simplify Navigation: Enable users to find any information within 3 clicks or less
- Increase Engagement: Improve time on site and reduce bounce rates by at least 25%
- Ensure Accessibility: Achieve WCAG 2.1 AA compliance for all users
Problem Statement
Challenges
UX Challenge
The current website lacked clarity about the product’s core purpose and offerings. Visitors couldn’t easily understand what the product was or how it could benefit them, creating significant barriers to engagement and conversion.
Solution
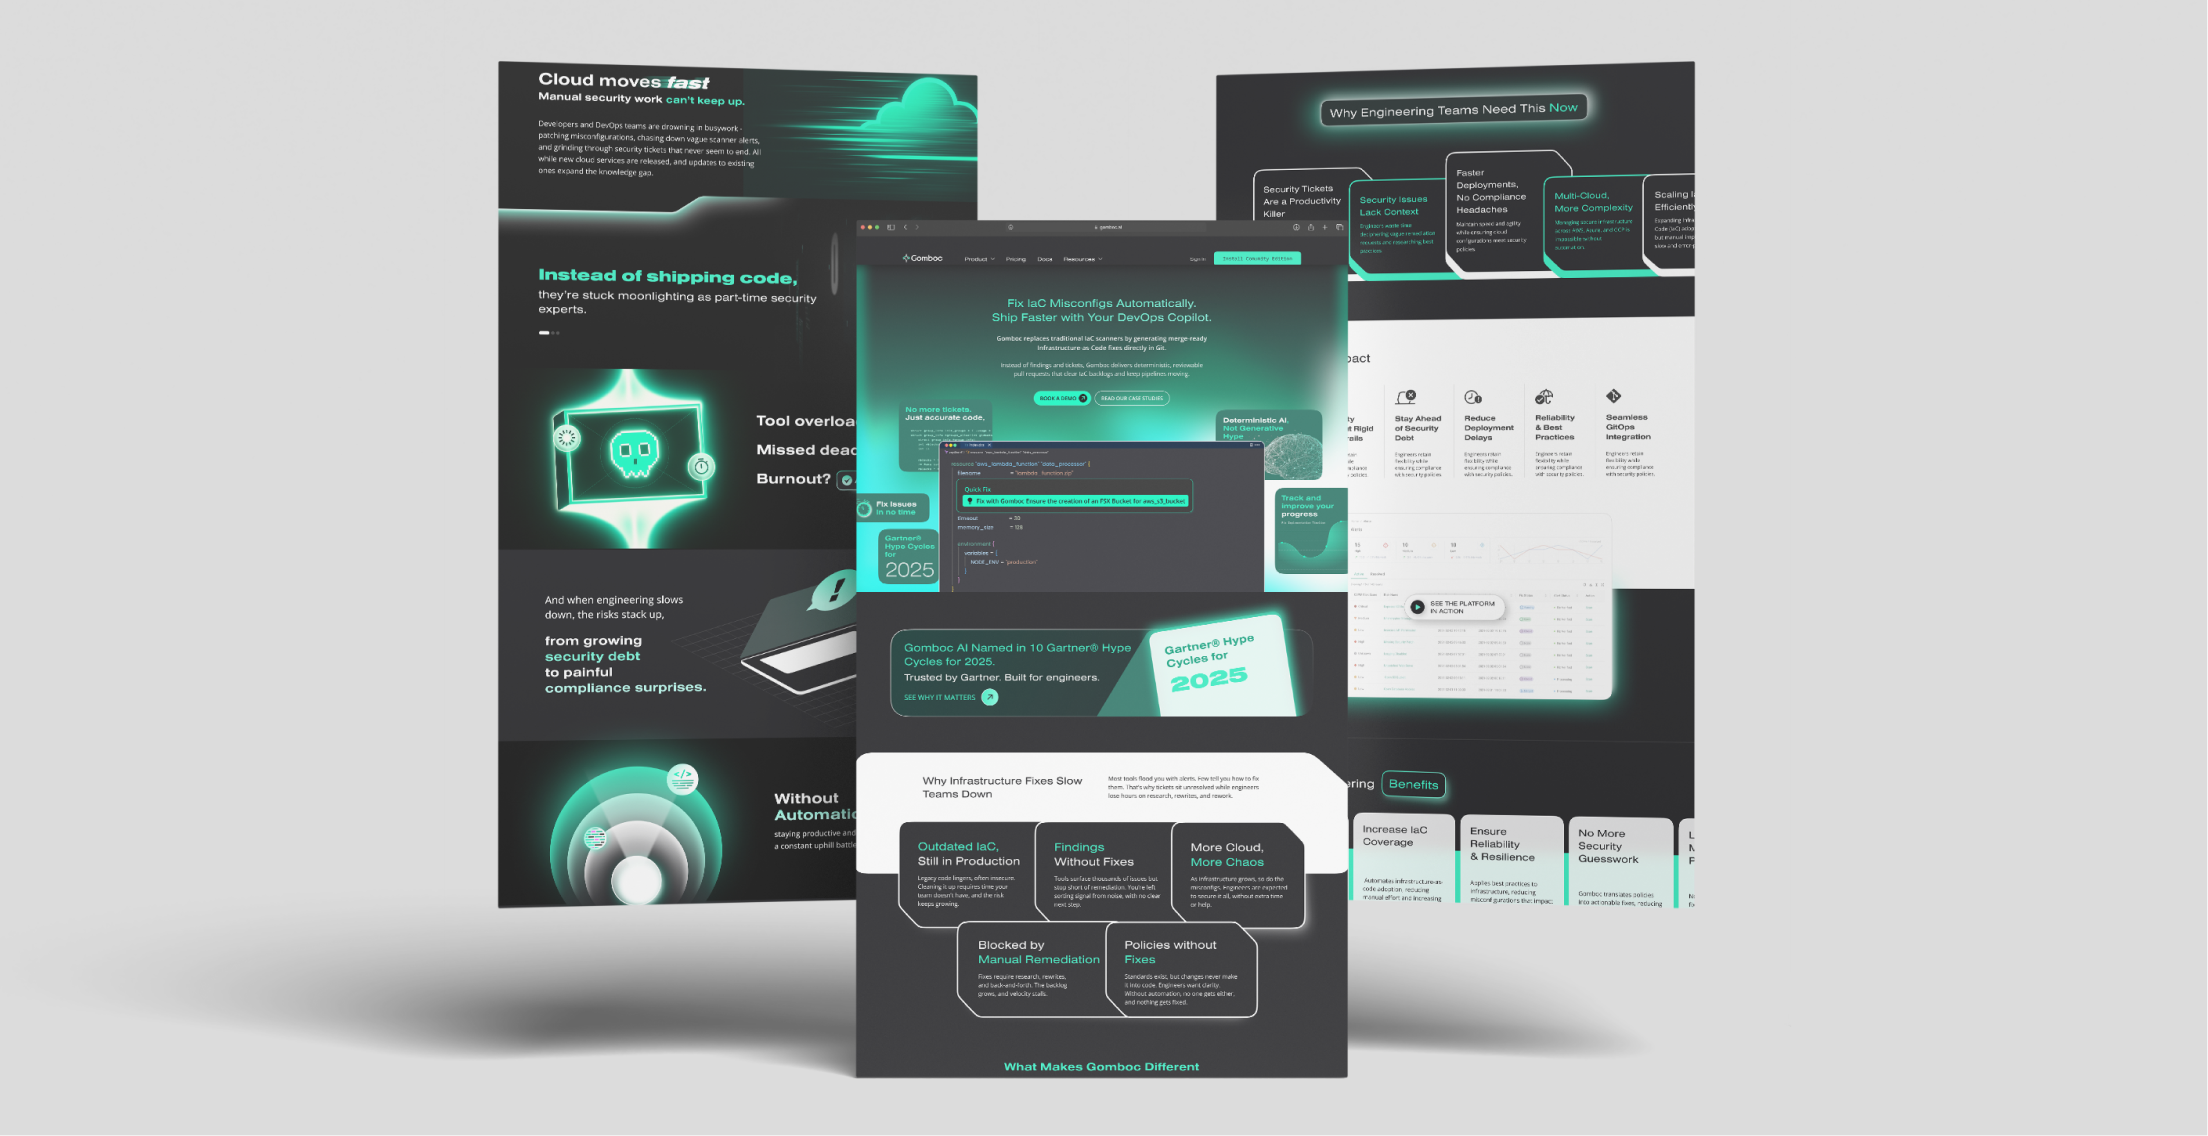
Redesigned the information architecture with clear value propositions and user-centric navigation. Created dedicated product pages with concise messaging, visual hierarchy, and compelling CTAs that immediately communicated the product’s benefits and use cases.
Developed a detailed content migration strategy with URL mapping, 301 redirects, and a phased rollout plan. Conducted content audits to consolidate, archive, or update pages while maintaining a clear sitemap that aligned with user journeys and business goals.
Platform Integration
Built a robust API integration framework with staging environment testing. Implemented integrations incrementally, thoroughly tested each connection, and created fallback mechanisms to ensure business continuity during the transition period.
SEO
Implemented comprehensive SEO best practices including optimized meta tags, schema markup, improved site speed, mobile responsiveness, and strategic keyword integration. Created an XML sitemap, fixed broken links, and established 301 redirects to preserve and build search authority.
Results & Impact
Performance Improvements
Page load time dropped from 8.2 to 1.4 seconds (83% improvement). Mobile performance score jumped from 32 to 94 on Google PageSpeed Insights. Server response time decreased from 1.2 seconds to 180 milliseconds, delivering significant gains across all metrics.
Business Outcomes
Organic traffic increased 47% within six months. Conversion rates improved 34% through better design and clearer CTAs. Bounce rate decreased 29% with improved navigation and engagement. Lead generation grew 52% via optimized conversion paths. Content updates that previously took days now happened in minutes.
User Satisfaction
User satisfaction scores rose from 3.2 to 4.6 out of 5. Task completion rates improved 41% with better navigation. Website-related support tickets decreased 67%. Time on site increased 38% as users engaged with more content. Mobile satisfaction jumped from 2.8 to 4.7.
SEO & Visibility
The data shows a massive surge in visibility, with total impressions skyrocketing from 3.01K to 24.2K. This is directly linked to a significant improvement in average position, which jumped from 31.5 (page 4) to 10.5 (the bottom of page 1). While this has led to a healthy increase in total clicks from 248 to 1.11K, the Average CTR (Click-Through Rate) has actually dropped from 8.2% to 4.6%, as the site now ranks for a broader range of keywords.User satisfaction scores rose from 3.2 to 4.6 out of 5. Task completion rates improved 41% with better navigation. Website-related support tickets decreased 67%. Time on site increased 38% as users engaged with more content. Mobile satisfaction jumped from 2.8 to 4.7.